What are you looking for?
Parameter and Device Analyzers, Curve Tracers
A family of precision current-voltage analyzers and curve tracers that offer a wide range of electrical characterization instruments to meet the needs of diverse users
Bundle with Select Modules and Save
Take advantage of our 15% bundle discount for advanced non-volatile memory tests when you purchase the semiconductor device analyzer and its modules.
Save Now on Semiconductor Analyzer Mainframe
Save 30% on the semiconductor device analyzer mainframe to accelerate the research and study of advanced devices.
Save Now on Power Device Analyzer Mainframe
Save 30% on the power device analyzer/curve tracer mainframe to accelerate the research and study of WBG power devices.
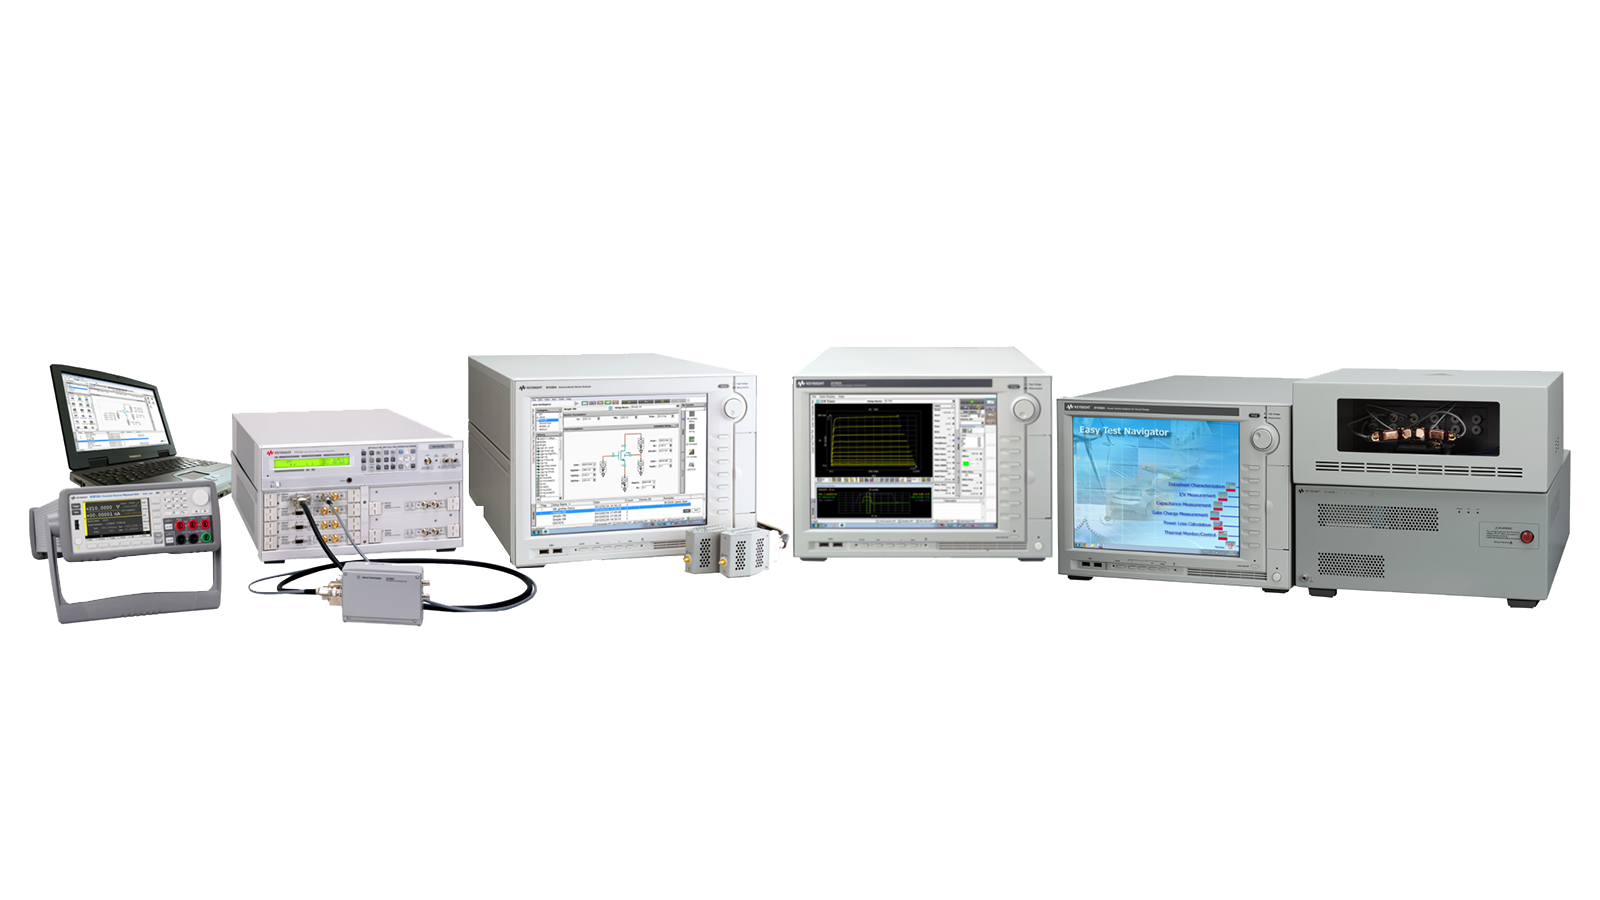
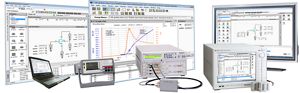
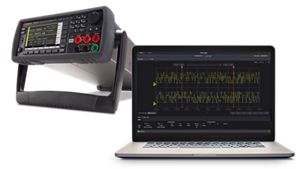
Precision Current-Voltage Analyzers Series
Precision Current-Voltage Analyzer Series ensures accurate and efficient current-voltage measurements that give a clear insight into IV characteristics across a wide range of applications. The powerful characterization software and integrated source and measurements units (SMUs) make it much quicker and simpler to obtain accurate IV characterization. The EasyEXPERT group+ software supports all the characterization tasks such as measurement setup and execution, data analysis, data management and protection and so on, using the graphical intuitive user interface and mouse/keyboard operation. The Current Voltage Analyzers Series provides a wide selection of IV analyzers suitable to your specific current voltage measurement needs in the range from an economic model to the most advanced analyzer capable of supporting cutting-edge applications.
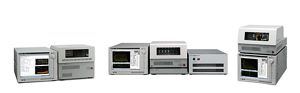
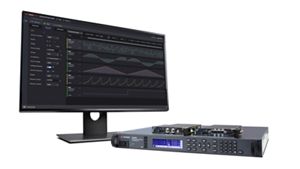
Curve Tracer / Power Device Analyzer Series
The Keysight Curve Tracer / Power Device Analyzers are the best solutions for power device evaluation. Curve Tracers / Power Device Analyzers have wide voltage and current coverage options ranging from 3 kV / 20 A to 10 kV / 1500 A and other features that make them capable of handling all types of power devices. The Series provides a wide selection of curve tracers suitable to the needs of power device manufacturers and power electronics circuit / product manufacturers.
Find the Series That's Right for You

Precision Current-Voltage Analyzer


Low-leakage Switch Matrix Mainframes

Power Device Analyzer / Curve Tracer
Related Use Cases

How to Evaluate IV Characteristics of LEDs

How to Bias Multiple Quantum Qubits
How to Evaluate IV Characteristics of Solar Cells


How to Make Resistance Measurements
How to Characterize Low-Power Integrated Circuits
-semiconductors-by-double-pulse-testing-/Use-Case-Webpage-Hero-Banner-characterize-wide-bandgap-WBG-semiconductors-1600x900.png)
-semiconductors-by-double-pulse-testing-/Use-Case-Webpage-Hero-Banner-characterize-wide-bandgap-WBG-semiconductors-1600x900.png)
How to Test Wide-Bandgap Semiconductors
Curve Tracer / Power Device Analyzer Featured Resources


Frequently Asked Questions – Curve Tracer / Power Device Analyzer
A curve tracer is a comprehensive tool designed for power electronics circuit designers. It helps in selecting the appropriate power devices by evaluating all relevant parameters under various operating conditions. This includes measuring IV characteristics like breakdown voltage and on-resistance, as well as FET parameters such as capacitance, gate charge, and power loss. For more information, refer to this Power Device Analyzer / Curve Tracer for Circuit Design brochure for more information.
A power device analyzer is a specialized measurement instrument designed to characterize and evaluate power semiconductor devices. It provides a complete solution for analyzing critical parameters of power devices, such as transistors, diodes, and other components used in power electronics.
A Curve Tracer specifically tests semiconductor devices by applying a series of voltages or currents to plot the current-voltage (I-V) characteristics, providing insights into the device's operational behavior. A Source Measure Unit (SMU) is a more versatile module that operates as a voltage or current source/sink across all four quadrants. It's integrated into complex testing systems to perform various electrical measurements with precise control and measurement capabilities of both voltage and current. While a Curve Tracer focuses on plotting I-V curves, an SMU offers flexibility in controlling and measuring voltage and current suitable for a broader range of testing and measurement applications. Refer to this Power Device Analyzer/Curve Tracer application note for more information.
A curve tracer is used to visually display and analyze the current-voltage (I-V) characteristics of electronic components, such as transistors, diodes, and power devices. It applies a varying voltage or current to the device under test (DUT) and plots the corresponding current or voltage response as a curve. This allows engineers and technicians to quickly assess the performance, identify defects, and understand the behavior of components under different conditions, making it a valuable tool in both design and troubleshooting.
I-V curve tracers work by applying a varying voltage or current to a device under test (DUT) and measuring the corresponding current or voltage. The tracer typically sweeps the voltage (or current) over a specified range while continuously recording the resulting current (or voltage). This data is then plotted on a graph showing the relationship between current and voltage. The I-V curve provides insight into the electrical characteristics of the component, such as threshold voltage, breakdown voltage, and overall performance under different operating conditions.


Want help or have questions?