What are you looking for?
PathWave Vector Signal Analysis (89600 VSA)
A comprehensive set of tools for demodulation and vector signal analysis
Overview
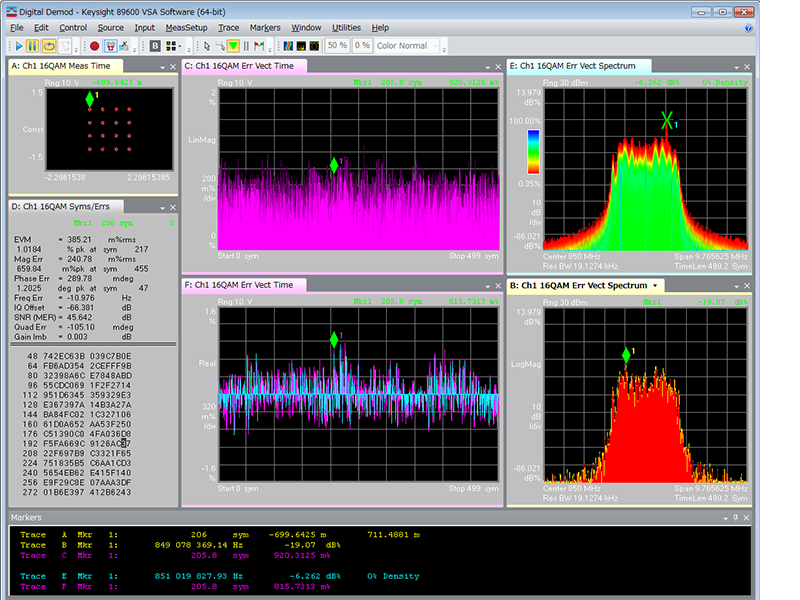
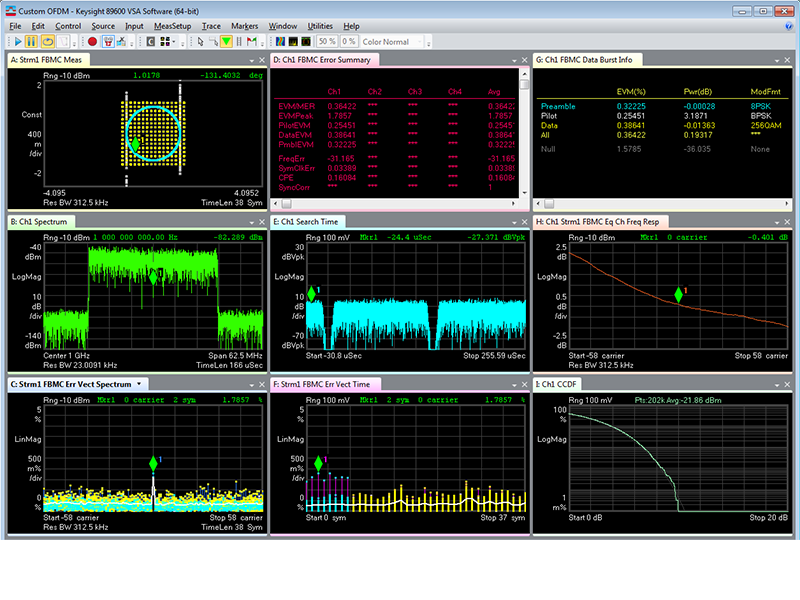
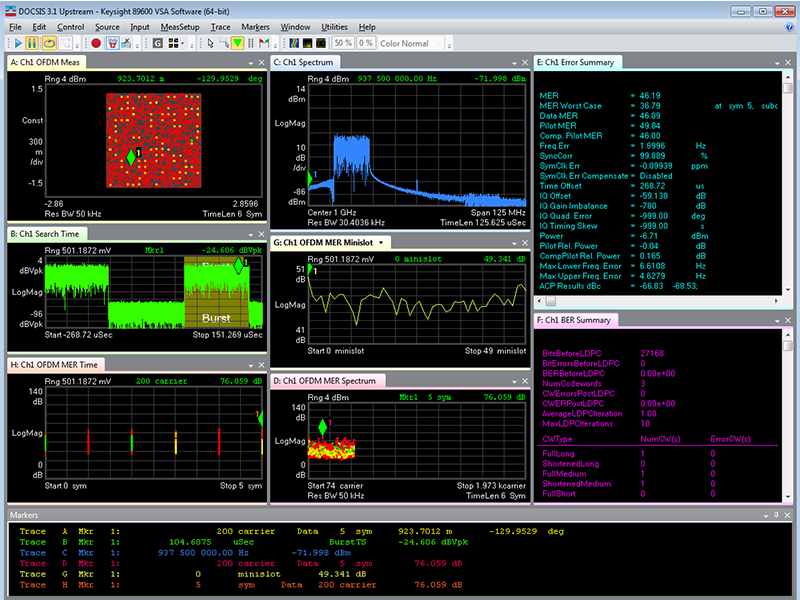
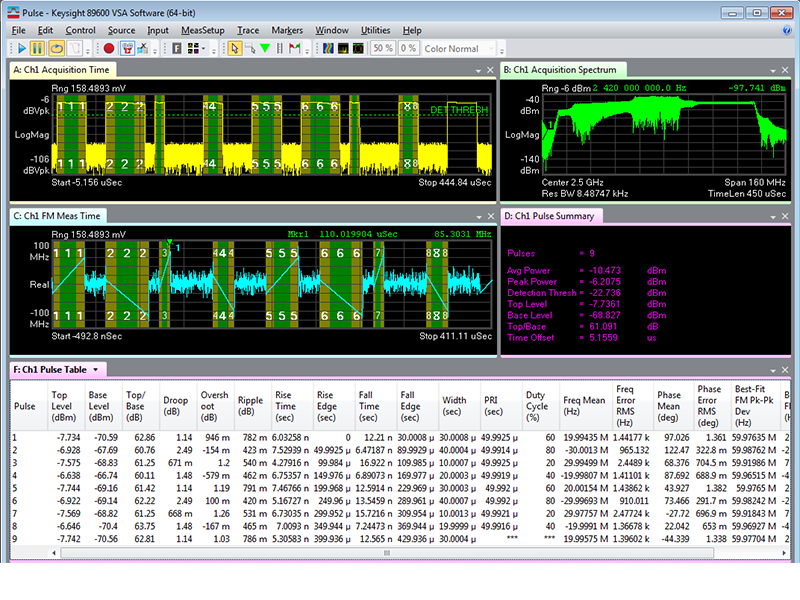
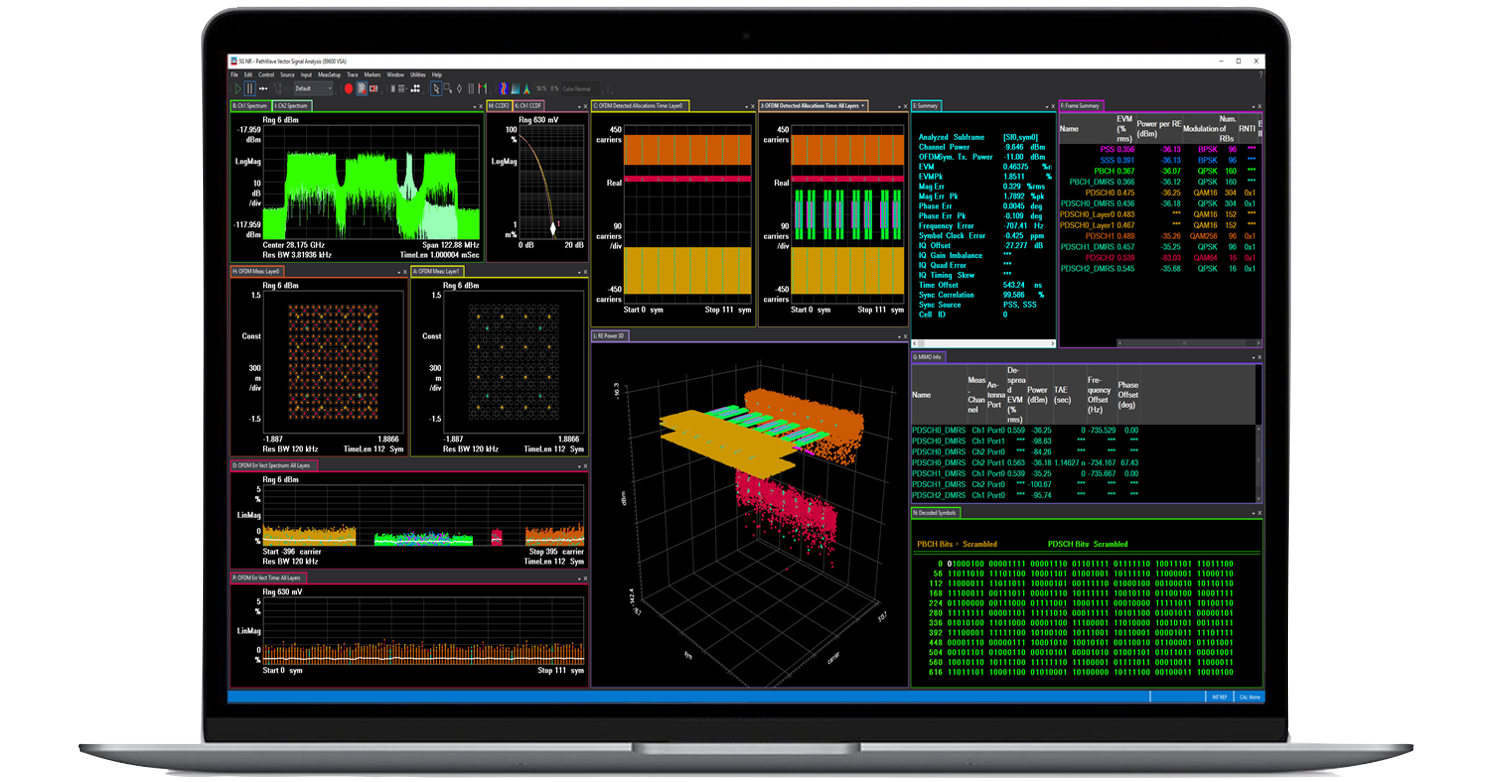
Discover signal analysis software tools to explore every facet of a signal and optimize your designs. Measure a broad range of signals including 5G, IoT, radar and more. Gain greater insight in frequency, time and modulation domains. Compatible with signal analyzers, network analyzers, oscilloscopes and many more test instruments.
How to Optimize 5G NR Measurements with PathWave Vector Signal Analysis Software
Learn how to achieve accurate Error Vector Magnitude (EVM) and validate physical channel coding in 5G New Radio (NR) testing. Error Vector Magnitude (EVM) assessment is crucial for evaluating signal quality between base stations and mobile handsets (user equipment). See best practices and the sequence of steps to get meaningful EVM measurements using the Keysight PathWave Vector Signal Analysis software. Get tips to optimize the overall system and troubleshoot problematic signals.
Frequently Asked Questions – PathWave VSA Software
What Is Signal Analysis Software?
Scalable and predictive signal analysis software enables fast and efficient analysis of signals. Process, share, and analyze signals at every stage in your product development workflow while combining design, instrument control, and application-specific signal analyzer software.
What Is Vector Signal Analysis Software?
Vector signal analysis software, also known as PathWave 89600 VSA, is ideal for evaluating and troubleshooting wireless signals in research and development (R&D). This software is PC-based, supporting numerous hardware measurement platforms like Keysight’s spectrum analyzers.
What Are Measurement Software Applications?
Measurement applications provide ready-to-use measurements for signal analysis. Measurement applications run either inside benchtop signal analyzers, on a PC for connection to the benchtop, or PXIe test instruments.
What Is the Difference Between Vector Signal Analysis Software and Measurement Application Software?
Measurement application software provides embedded format-specific, one-button measurements for signal analyzers. With fast measurements, pass/fail testing and simplicity of operation, measurement software applications are ideally suited for automated design verification and manufacturing tests.
Vector signal analysis software is ideal for evaluating and troubleshooting wireless signals in R&D. PC-based, supporting numerous hardware measurement platforms, the PathWave Vector Signal Analysis (VSA) software provides flexibility and sophisticated measurement tools essential to find and fix signal problems.
What signal standards and modulation types are supported by the Pathwave Vector Signal Analysis software?
With PathWave Vector Signal Analysis software, you can measure more than 75 signal standards and modulation types for cellular communications, giving you the versatility to analyze signals across different technologies efficiently.
Can signal analysis software display multiple measurements at once for evaluation?
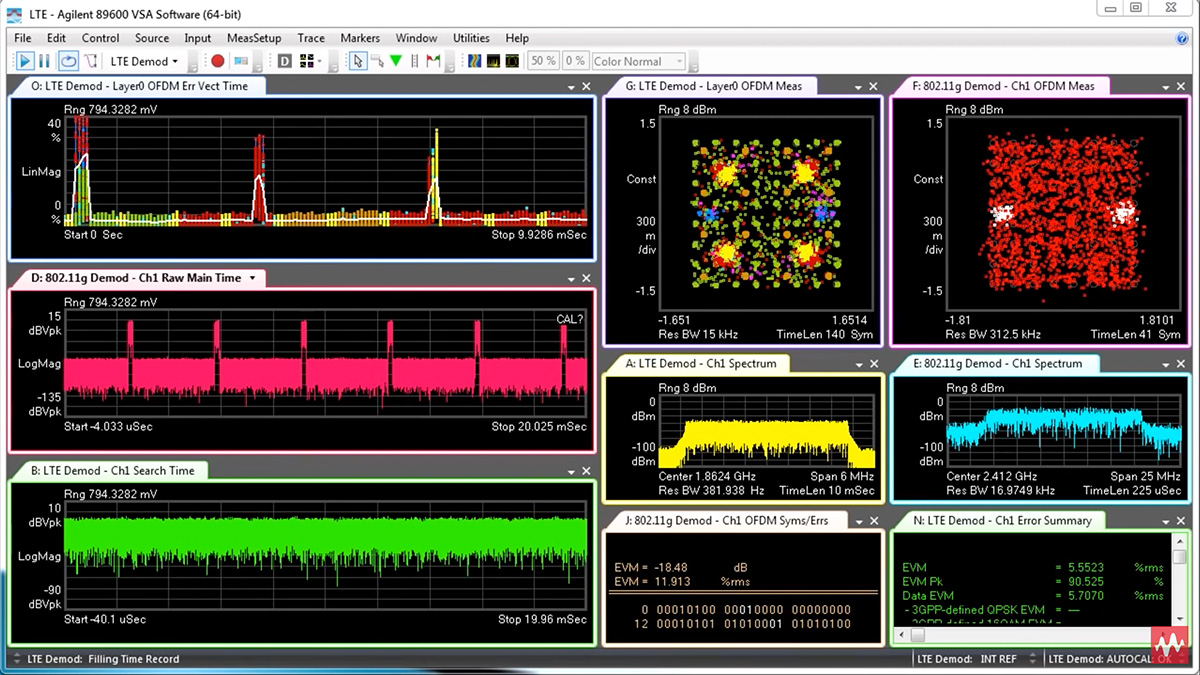
Pathwave Vector Signal Analysis software can configure, execute, and display multiple measurements simultaneously. For example, you can analyze the coexistence of 5G and LTE signals leveraging Dynamic Spectrum Sharing. A collection of measurements can be created and stored in memory, available to run instantly. Connect to multiple analyzers at the same time, or use a single multi-channel instrument, to acquire signals from different test points or frequency bands in parallel.
Extend the Capabilities
Featured Resources
Want help or have questions?

