What are you looking for?
AppStack Software Suite
Context aware, signature based application layer filtering

Improve Your Visibility Solutions Through Highly Accurate Application Identification
Relying on both static traffic pattern identification and dynamic application discovery, AppStack provides a comprehensive view of which applications are running within your network, what bandwidth they consume, and where these applications are running geographically. Using AppStack, you can define traffic filters to view or forward specific traffic patterns that you want to monitor, based on application type, operating system, transport protocol, and other criteria. In addition to packet forwarding, NetFlow/IPFIX/JSON information, optionally enhanced with application layer data (IxFlow), can be sent to tools, enhancing their capability to report granular user and application data.
AppStack Features

Application Identification

Geolocation and Tagging
RegEx Filtering

IxFlow

Packet Capture
Application Signature Subscription
Key Specifications
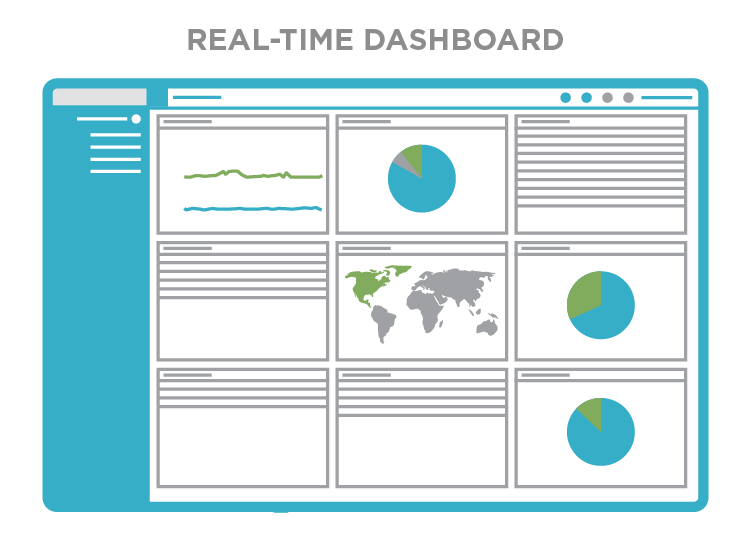
Realtime Dashboard
YES
Filter Application Traffic
with enhanced NetFlow/PFIX/JSON
Application signatures
managed and maintained by Keysight
Improved visibility
highly accurate application identification
Want to see more specifications?
Stack On - Raise Your Visibility IQ
True intelligence. Application filtering that does NOT require any RegEx! AppStack ties capabilities back to Application Signatures to ensure up to date information on applications, geographies and more. We leverage technology to create and update application signatures; we allow you to pinpoint where in the world traffic is coming and going from and even capture data for traffic analysis. Beyond that, forward NetFlow traffic with the option to add custom metadata.
Since we added true intelligence, we added a real-time dashboard so you can get actionable insights to mitigate threats and identify trends. View your network application traffic distribution: top counties, top filters, top service providers, top browsers, top device OS types. Graphs and charts show application traffic sources and breakdowns — allowing you to easily see and manage.
Find Your Platform
Protect Your Investment
Featured Resources
Want help or have questions?
