D9110PWRA Power Supply Analysis Software (Input, Switching, Output, SOA)
Data Sheets
Introduction
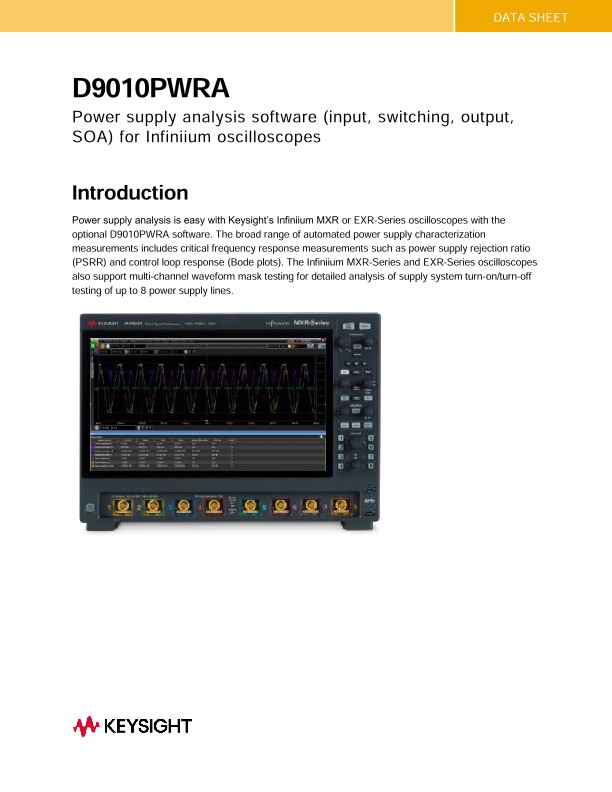
Power supply analysis is easy with Keysight’s Infiniium MXR or EXR-Series oscilloscopes with the optional D9010PWRA software. The broad range of automated power supply characterization measurements includes critical frequency response measurements such as power supply rejection ratio (PSRR) and control loop response (Bode plots). The Infiniium MXR-Series and EXR-Series oscilloscopes also support multi-channel waveform mask testing for detailed analysis of supply system turn-on/turn-off testing of up to 8 power supply lines.
The Power Measurements Software Package enables a broad range of automated power supply characterization measurements on Keysight Infiniium EXR-Series and MXR-Series oscilloscopes including unique frequency response analysis for performing control loop response and power supply rejection ratio (PSRR) measurements. Table 1 lists the specific measurement capabilities that are enabled on each series with the Infiniium Power Supply Analysis Package.
While designed to measure the rigorous operating parameters of switched-mode power supplies, the measurements can also be used as a toolkit of measurements for any power converter and/or inverter. These measurements provide an ideal method to document the performance parameters of your power system.
Input Analysis
Real power |
The portion of power flow that, averaged over a complete cycle of the AC waveform, results in net transfer of energy in one direction. |
Apparent power |
The portion of AC line power flow due to stored energy, which returns to the source in each cycle. |
Reactive power |
The difference between apparent power and real power due to reactance. |
Power factor |
The ratio of the actual AC line power to the apparent power. |
Crest factor (V&I) |
The ratio between the instantaneous peak AC line current/voltage required by the load and the RMS current/voltage. |
Phase angle |
The angle between the apparent power and the real power |
Current harmonics |
For the first 40 harmonics, Harmonic, Actual Value (RMS), Limit (RMS), Margin, Pass/Fail Status |
Inrush current |
Peak inrush current of the power supply when the power supply is first turned on. |
Switching Device Analysis
Switching loss |
Calculates the power dissipated in the switching cycles across the switching device. |
RDS(ON) |
Measures RDS (ON) characteristics of a switching device |
VCE(SAT) |
Measures VCE(SAT) characteristic of a switching device |
Slew rate (V&I) |
Rate of voltage or current change during switching |
Modulation analysis |
Modulation analysis measures the control pulse signal to a switching device (MOSFET) and observes the trending of the pulse width, duty cycle, period, frequency, etc. of the control pulse signal in response to different events. |
Safe operating area (SOA) |
Plots an I-V curve and compares it against mask limits |
Output Analysis
Output ripple |
Ripple noise of the power supply output |
Turn on/off time |
Determines how fast a turned-on power supply takes to reach 90% of its steady-state output. Determines how fast a turned-off power supply takes to reduce its output voltage to 10% of the maximum. |
Efficiency |
Overall efficiency of the power supply by measuring the output power over the input power. |
Transient response |
Determines how fast a power supply's output voltage responds to change at the output load. |
Frequency Response
PSRR (Power Supply Rejection Ratio) |
Determine voltage regulator rejection ripple noise over a specified frequency range |
Control loop response |
Bode analysis performs a gain/phase plot over a specified frequency sweep. |
Frequency Response Analysis (Bode plots) |
Bode analysis performs a gain/phase plot over a frequency sweep. (Included with the WaveGen option EXR2WAV / MXR2WAV, as well as the Power Supply Test Software D9010PWRA.) |